
From Product Photos to Supply Chain Decisions
A new dress arrives in a retailer’s catalog with a photograph, a short description and no sales history. Before placing the first order, the buyer needs useful comparisons with products sold before. The cut and pattern may matter more than a description that says little beyond “women’s dress.”
Lokad can now use product photographs in its supply chain calculations. The capability is built into Envision, Lokad’s programming language for forecasting and supply chain decisions. It turns each image into an embedding: a compact numerical description that makes visual information usable in those calculations.

What an embedding does
A photograph contains millions of pixel values. A model trained on images converts them into a much shorter list of numbers: the embedding. These numbers represent visual patterns, including shapes, textures and the arrangement of elements in the picture. They are not a list of labels such as “blue” or “long sleeves.”
Comparing two embeddings gives a measure of visual resemblance. Two floral summer dresses will often be a closer match than a dress and a winter coat, even if one dress has a detailed description and the other has only a supplier’s code. The software can find these relationships across a catalog without someone labeling every visible feature.
Lokad already uses text embeddings to compare descriptions. Image embeddings add a complementary view of products whose names and written specifications may tell only part of the story.
Learning from products already sold
For a launch, visual resemblance can help select earlier products whose sales histories deserve weight. Their seasons, sales channels and availability still matter. A similar dress may show few sales because it arrived late or was often out of stock. Those records need to be interpreted before they become a forecast for the new item.
Seasonality offers another use. A new item has no seasonal history, but older products with related visual characteristics may provide evidence about when it will sell. The seasonal pattern comes from dated sales; the image helps the model decide which histories are relevant.
Images can also help classify catalogs with sparse descriptions. A classifier trained on the retailer’s own categories can use visual information to suggest a category or flag a product that appears out of place. This avoids making catalog enrichment depend entirely on someone labeling products one by one.
For substitution and cannibalization, resemblance identifies candidate alternatives. Sales and availability records are needed to estimate whether customers switch between them, or whether a new style diverts demand from an existing one. Two dresses can look alike while serving different customers at different prices. The image supplies evidence to a model that must account for those differences.
A reusable part of the calculation
A familiar demonstration shows a product photograph beside a gallery of similar products. That is useful for browsing. Supply chain calculations need access to the underlying representation so they can use it for other purposes.
In Envision, embeddings can be stored and used in calculations, much like numbers. Lokad’s Supply Chain Scientists use this language to develop each client’s forecasting and decision logic. They can compare one product’s image embedding with another’s, and combine visual and textual signals in a model alongside prices, transactions and stock availability.
These calculations can participate in autodiff, Envision’s mechanism for learning model parameters from observations. A scientist can fit a model that learns how visual information relates to sales in the client’s business. The image model supplies the visual representation; the client’s records teach the supply chain model how to use it.
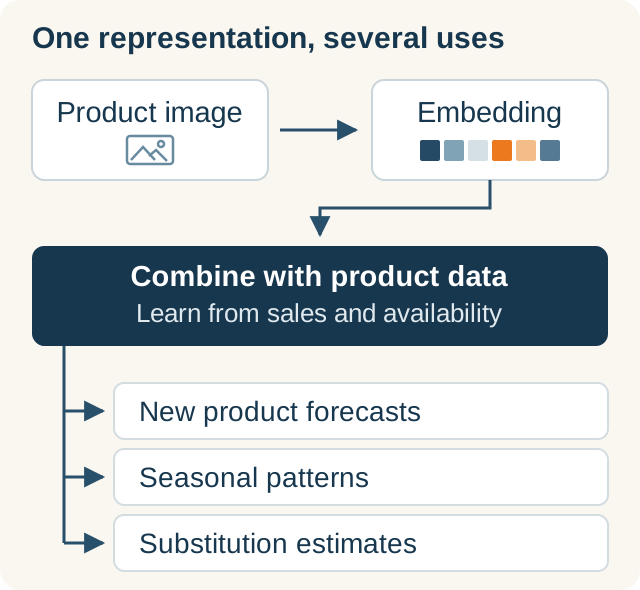
The same image representation can serve several models. Each use needs its own business evidence and validation.
A recipe developed to forecast launches might later need to account for a new style competing with the existing assortment. The visual information remains available for that work. The scientist can extend the calculation without building another image-processing service.
The engineering behind a few lines
We use a pretrained image model developed by another team. Our engineers make that model usable inside supply chain calculations that must run reliably every day.
In my experience, a visual-similarity prototype is a few hours’ work in Python. It was already approachable before coding agents; they make it easier still. The amount of code an agent can produce tells us little about the burden of owning it.
A prototype assembled from software packages inherits code from their maintainers and from the maintainers of their dependencies. A compromised package can put the data and credentials available to that process at risk. Even honest, useful packages can be abandoned. Someone must decide which code to trust, review changes and keep the whole arrangement working. Generating thousands of lines for the surrounding service adds another maintenance obligation.
With the images stored in Lokad, reading their embeddings and comparing them takes a handful of Envision lines. The scientist does not have to install an image-processing library or maintain a separate application to run the image model. The recipe specifies how the visual information contributes to the supply chain calculation.
Lokad maintains the software that reads the images, runs the model and executes the Envision scripts. This gives our engineers control over the path from the image file to the numerical calculation. Dependencies still require judgment and maintenance, but that responsibility belongs to the platform team rather than being repeated in each client’s project.
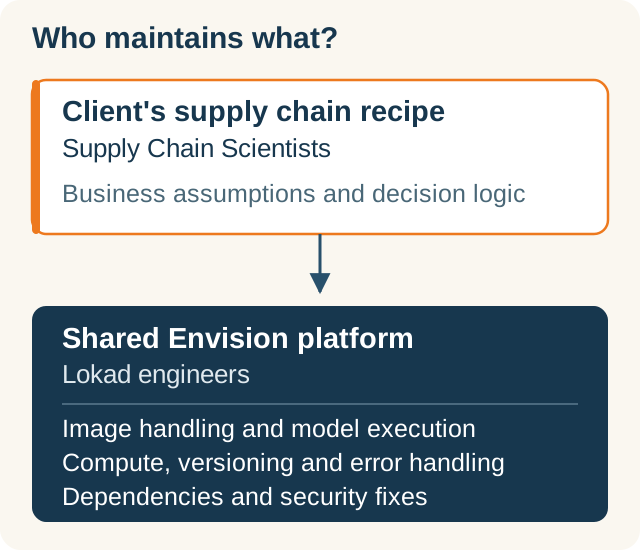
The scientist maintains the business logic. Lokad’s platform team maintains the software that processes the images and executes the calculation.
Processing a large catalog requires limits on memory use. Daily runs should reuse work already done on unchanged images. If an image is missing or damaged, the scientist needs to know which one caused the problem. Changes to the processing software must be reflected in which results can be reused. We handle these concerns within the platform, alongside the execution of the rest of the recipe.
A product’s visual information can then be used throughout the same calculations as its description, price and sales history. The scientist can change how those signals are used without rebuilding the software that produces them.


