Probabilistic Forecasts (2016)


Embracing uncertainty
In our experience, no amount of fine-tuning the existing forecasting models, and no amount of R&D to develop better models - in the traditional sense - can fix this problem. Methods like safety stock analysis are supposed to handle uncertainty, but in practice, safety stock analysis is merely an afterthought. In supply chain management, costs are driven by extreme events: it’s the surprisingly high demand that generates stock-outs and customer frustration, and the surprisingly low demand that generates dead inventory and consequently costly inventory write-off. As all executives know, businesses should hope for the best, but prepare for the worst. When the demand is exactly where it was expected to be, everything goes smoothly. However, the core forecasting business challenge is not to do well on the easy cases, where everything will be going well even considering a crude moving average. The core challenge is to handle the tough cases; the ones that disrupt your supply chain, and drive everybody nuts.

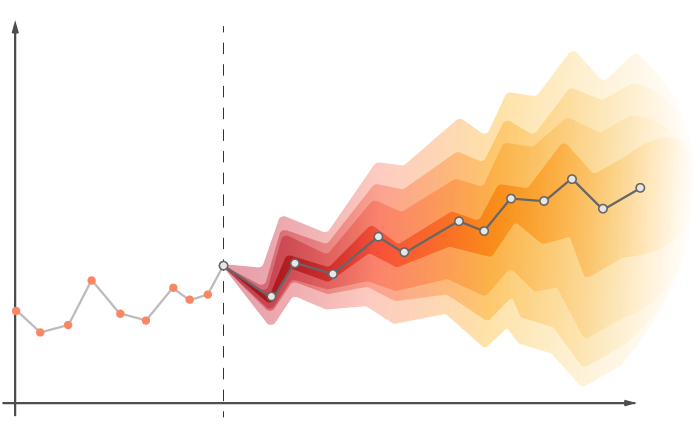
These probabilistic forecasts provide an entirely new way of looking at the future. Instead of being stuck in a wishful thinking perspective, where forecast figures are expected to materialize, probabilistic forecasts remind you that everything is always possible, just not quite equally probable. Thus, when it comes to preparing for the worst, probabilistic forecasts provide a powerful way of quantitatively balancing the risks (while traditional forecasts remain blind to the latter).
While risk analysis tends to be an afterthought in traditional forecasting approaches, Lokad is bringing the case front and center with probabilistic forecasts.
From a practitioner’s perspective
Probabilistic forecasts might sound very intimidating and technical. Yet, the chances are, if you are a supply chain practitioner, you have been doing “intuitive” probabilistic forecasting for years already: think of all the situations where your basic forecasts had to be revised up or down, because the risks were just too great… This is exactly what probabilistic forecasts are about: properly balancing real-world decisions when facing an uncertain future. While risk analysis tends to be an afterthought in traditional forecasting approaches, Lokad is bringing the case front and center with probabilistic forecasts.
The data output of the probabilistic forecasting engine are distributions of probabilities. From a practical perspective, while this information is extremely rich (it is, after all, a glimpse at many possible futures!), it is also fairly impractical to use in its raw form. As a result, Lokad provides an entire platform, all the necessary tools and team support, to allow your company to turn these probabilities into business decisions, such as reorder quantities.

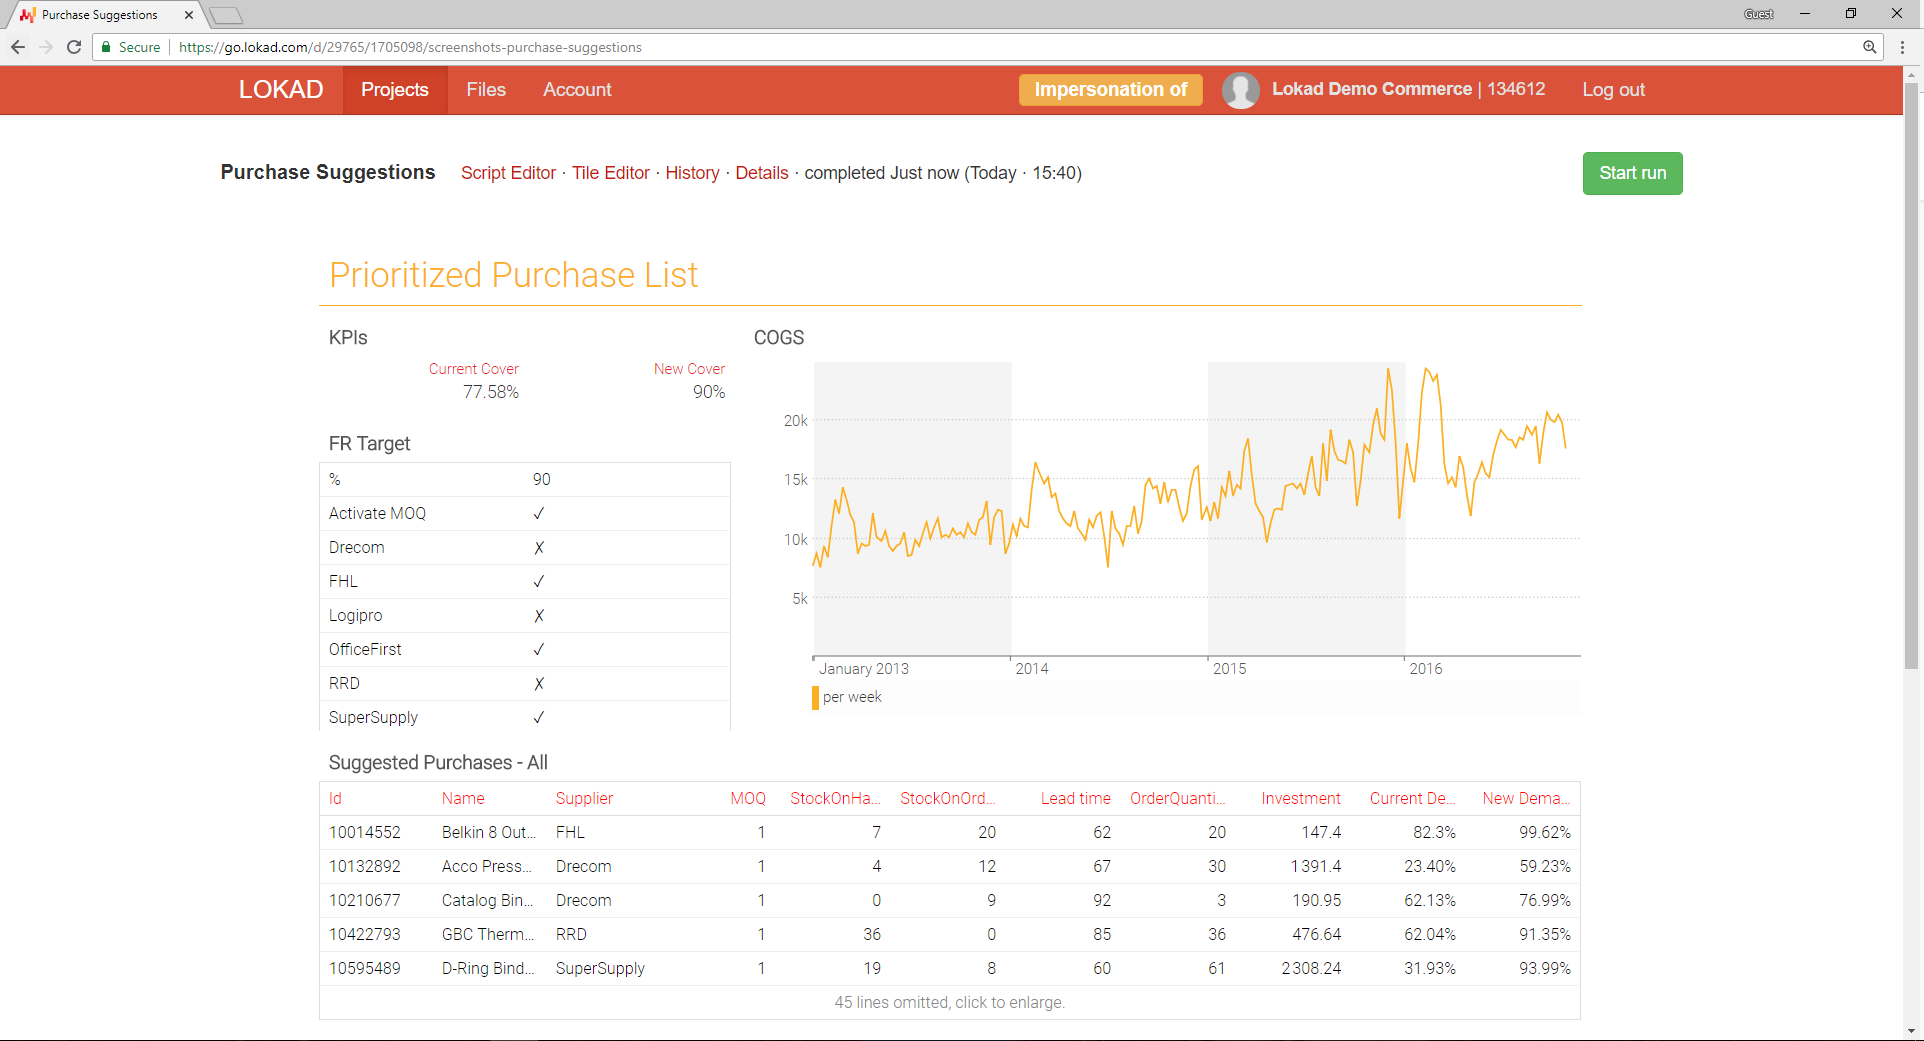
Lokad’s webapp features Big Data processing capabilities, and allows you to create the necessary business logic that turns these forecasts into decisions, which are specifically adapted to your business. These decisions can be adjusted to fit your particular supply chain constraints, such as MOQs (minimum order quantities) for example, your economic drivers, such as risks associated with shelf-life expiration, and your processes, such as daily purchase orders to be made before 8am every day.
Robotization through machine learning
Supply chain management frequently involves many products moved across many locations. Traditional forecasting solutions tend to rely heavily on fairly manual adjustments whenever advanced statistical patterns, such as new products or product life-cycle effects, are involved. However, at Lokad, our experience indicates that if a forecasting solution requires fine-tuning there is just no end to it: no matter how many weeks or months of manpower are dedicated to making the solution work, there is a constant need for more fine-tuning, just because there are too many products, too many locations and the business keeps changing.
Therefore, at Lokad, we have decided to opt for a full robotization of the forecasting process. This means that
- zero statistical knowledge is required to obtain forecasts
- zero fine-tuning is expected to be provided for adjusting forecasts
- zero maintenance is required to keep the forecasts aligned with your business

As a minor drawback, these algorithms happen to consume a lot more processing power than their traditional counterparts. However, this challenge is addressed through cloud computing that keeps the forecasting engine running smoothly, no matter what amount of data is involved.
The origin of our probabilistic forecasts
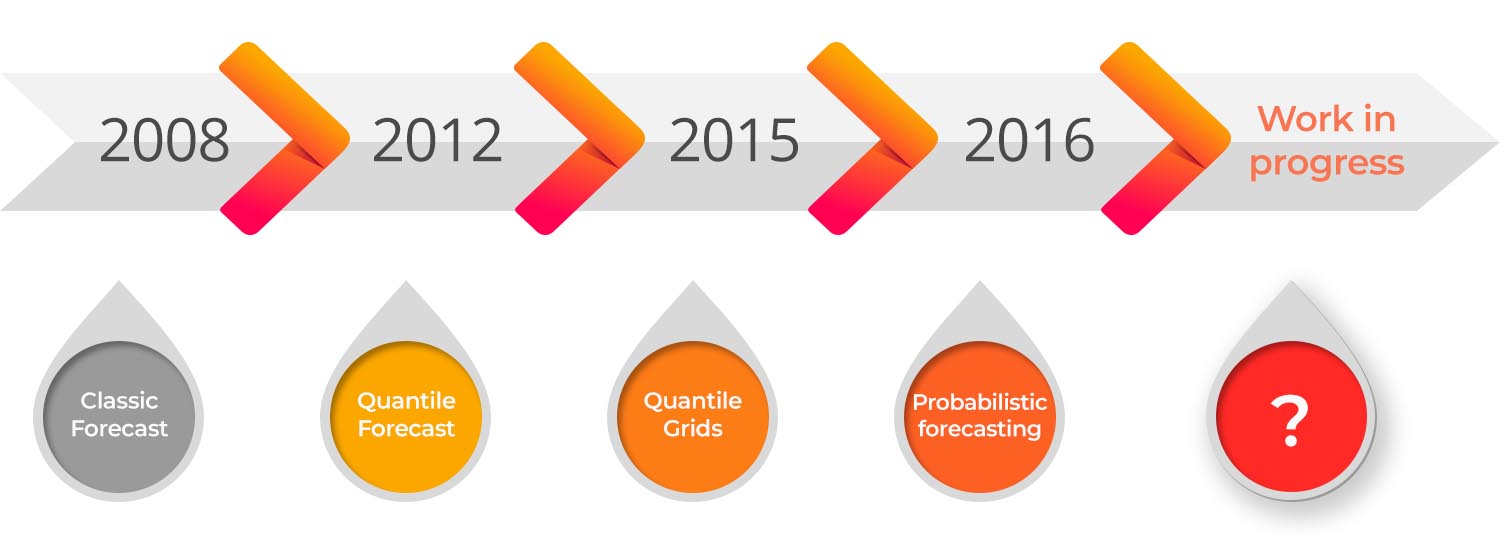
Lokad did not invent probabilistic forecasting, other mathematicians did, mostly by using the concept for addressing a very different set of issues such as commodity stock price forecasting or weather forecasting. Also, Lokad did not use probabilistic forecasting from the very beginning; we went through classic forecasting (2008), quantile forecasting (2012) and quantile grids (2015)

prior to this. As a result, probabilistic forecasts are actually the 4th generation of our forecasting technology. From the experience gained on the previous iterations of this technology, we have gained a considerable amount of know-how when it comes to designing a forecasting engine suitable for covering a wide range of business situations.
The very idea of estimating probabilities rather than an average came from our early years when we were still trying to get the classic approach to work. It took us quite a few failures to realize that the classic approach was intrinsically flawed, and that no amount of R&D could fix a broken statistical framework. The statistical framework itself had to be fixed in the first place in order to get the forecasting model to work.
In addition, each iteration of our forecasting engine has been a generalization - from a mathematical perspective - of the previous version, with every new generation of our forecasting engine being capable of handling more situations than the previous one. Indeed, it’s better to be approximately correct than exactly wrong. The toughest situations are encountered when the forecasting engine cannot generate forecasts which would be the most appropriate to fit a given business situation because the engine is not expressive enough. Or when the forecasting engine cannot process the input data which would be truly relevant for gaining statistical insights on any given situation because, once again, the engine lacks expressiveness. At Lokad, forecasting is a work in progress. While we are proud of what we have built with our probabilistic forecasting engine, this is not the end of our efforts. Unlike on-premise solutions, where upgrading to a new tool is a challenge of its own, Lokad’s clients benefit from our next generation forecasting engine as soon as it becomes available.
Our forecasting FAQ
Which forecasting models are you using?
We are using many forecasting models. Most of the models that we are using nowadays would be considered as machine learning algorithms. These models have been developed by Lokad, and typically do not have named counterparts in scientific literature. When we started back in 2008, we had re-implemented all the classics (Box-Jenkins, ARIMA, Holt-Winters, exponential smoothing, etc); but these models fell in disuse as they simply cannot compete with our most recent models.
How do you pick the model(s) to be used?
Selecting the right model or the right convex combination of models is half the battle when it comes to building a good forecast in the first place. From a statistical perspective, a system capable of always choosing the “best” model would be strictly equivalent to a system that always chooses the “perfect” forecasts. In practice, our forecasting engine relies heavily on backtesting to select the best set of models.
Does your forecasting engine handle seasonality, trends, days of week?
Yes, the forecasting engine handles all the common cyclicities. Our models also intensively use a multiple time-series approach to leverage the cyclicities observed in other products in order to improve the forecasting accuracy of any one given product. Naturally, two products may share the same seasonality, but not the same day-of-week pattern. We do have models to handle this as well.
What data do you need?
In order to forecast demand, the forecasting engine needs to be provided - at least - with the daily historical demand, and providing a disaggregated order history is even better. As far as the length of the history is concerned - the longer it is, the better. While no seasonality can be detected with less than 2 years of history, we consider 3 years of history to be good, and 5 years excellent. In order to forecast the lead times, the engine typically requires the purchase orders to contain both the order dates and the delivery dates. Specifying your product or SKU attributes helps to considerably refine the forecasts too. In addition, providing your stock levels is also very helpful to us for getting a first meaningful stock analysis over to you.
Can you forecast my Excel sheet?
As a rule of thumb, if all of your data fits into one Excel sheet, then we usually cannot do much for you; and to be honest, nobody can either. Spreadsheet data is likely to be aggregated per week or per month, and most of the historical information ends up being lost through such aggregation. In addition, in this case, your spreadsheet is also not going to contain much information about the categories and the hierarchies that apply to your products either. Our forecasting engine leverages all the data you have, and doing a test on a tiny sample is not going to give satisfying results.
What about stock-outs and promotions?
Both stock-outs and promotions represent bias in historical sales. Since the goal is to forecast the demand, and not the sales, this bias needs to be taken into account. One frequent - but incorrect - way of dealing with these events consists of rewriting the history, to fill in the gaps and truncate the peaks. However, we don’t like this approach, because it consists of feeding forecasts to the forecasting engine, which can result in major overfitting problems. Instead, our engine natively supports “flags” that indicate where the demand has been censored or inflated.
Do you forecast new products?
Yes, we do. However, in order to forecast new products, the engine requires the launch dates for the other “older” products, as well as their historical demand at the time of the launch. Also, specifying some of your product categories and/or a product hierarchy is advised. The engine does indeed forecast new products by auto-detecting the “older” products, which can be considered as comparable to the new ones. However, as no demand has yet been observed for the new items, forecasts fully rely on the attributes that are associated with them.
Is it possible to adjust the forecasts?
Nearly a decade of experience in statistical forecasting has taught us many times over that adjusting forecasts is never a good idea. If forecasts need to be adjusted, then there is probably a bug in the forecasting engine that requires to be fixed. If there is no bug to be fixed, and the forecasts are carried out just as expected from a statistical perspective, then adjusting them is probably the wrong answer to the problem. Usually, the need to adjust forecasts reflects the need to take into account an economic driver of some kind; which impacts the risk analysis “on top” of the forecast, but not the forecast itself.
Do you have experience with my vertical?
We have experience with many verticals: fashion, fresh food, consumer goods, electronics, spare parts, aerospace, light manufacturing, heavy manufacturing, etc. We also handle diverse types of industry players: e-commerce businesses, wholesalers, importers, manufacturers, distributors, retail chains, etc. The easiest way to be sure that we have experience with your vertical is to get in touch with us directly.
Do you use external data to refine the forecasts?
No. While your forecasts benefit from all the know-how and the overall system tuning we have gained while working with other clients, your forecasts do not contain any data obtained from external data sources, either from other Lokad clients or from public datasets. Similarly, your data is only ever used for purposes explicitly associated with your company account, and nothing else.
